Financial statistics & reports
The ledger answers "what happened on this night?". Two buttons at the top of it answer the bigger questions:
- Statistics shows four charts for the period you're looking at. Quick, on screen, nothing to set up.
- Report builds a PDF. You choose the dates and what goes in. It's made for printing, for the treasurer's folder, or for the annual club meeting.
Both are part of club financials, so they need the club owner's Commercial license (see Who can see the books). Without it, both work on the example data, so you can try them before buying.
Examples on this page use the demo club Harbor Lights Poker Club and its year 2026.
Statistics
Pick a period in the ledger, for example Year 2026, and click Statistics. The window covers the whole period, not just the 20 entries on the current page:
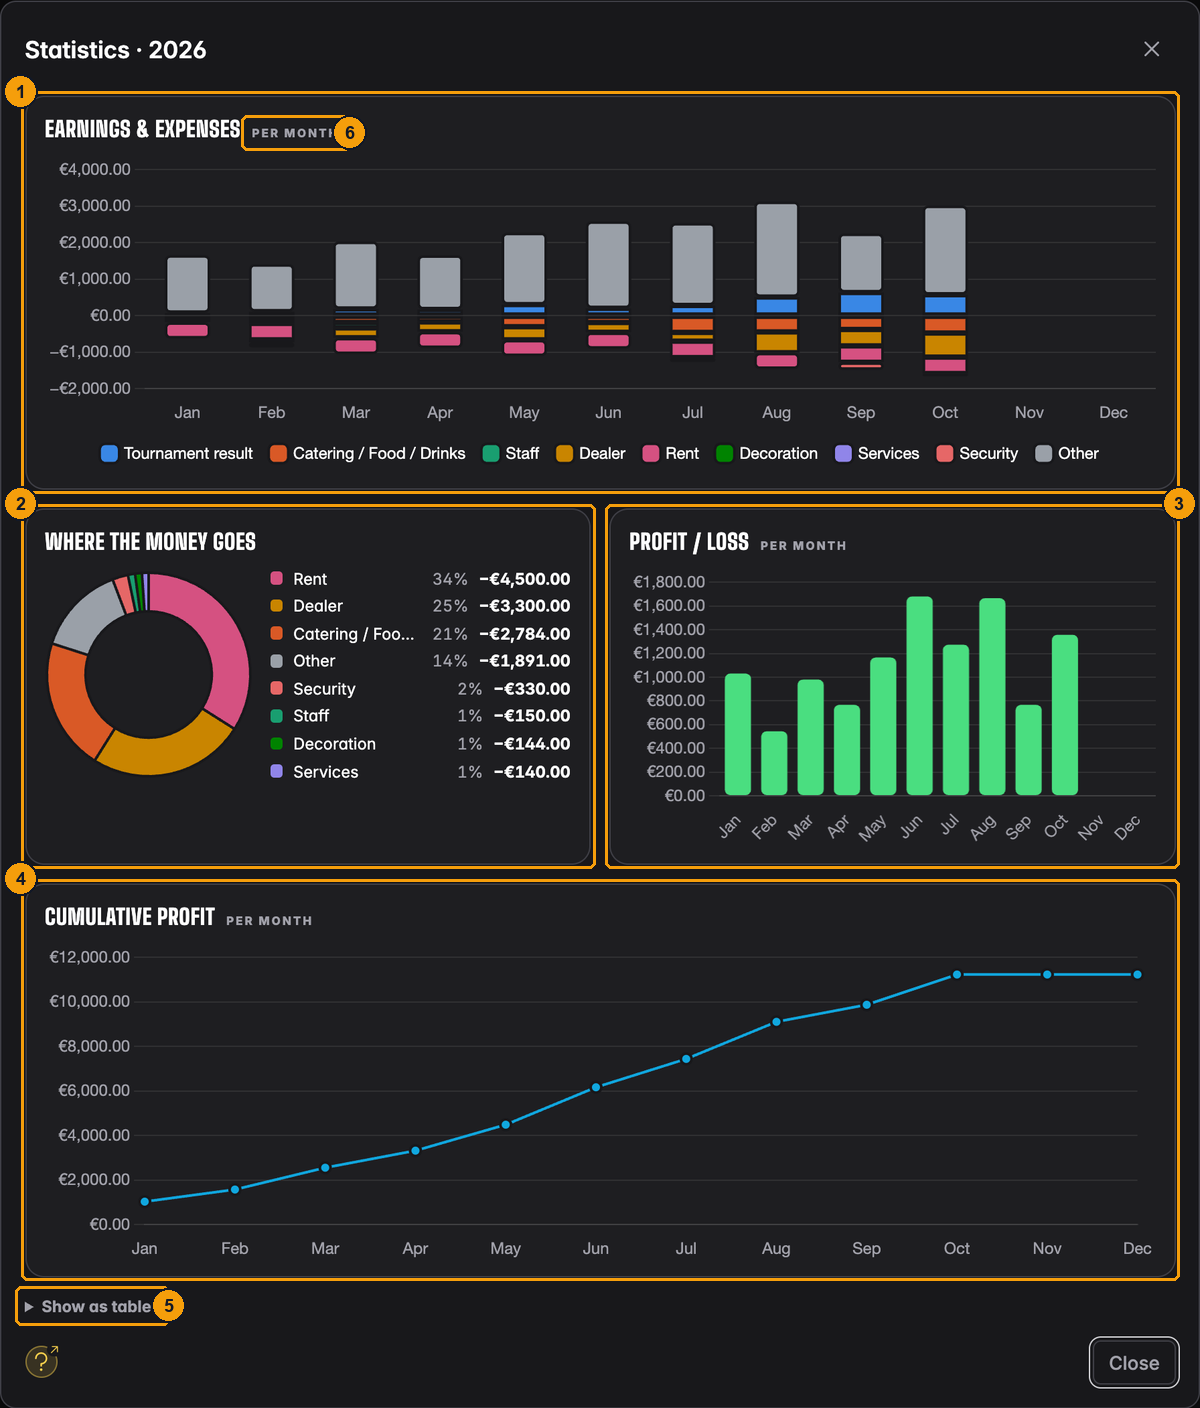
- Earnings & expenses: what came in and went out, by type.
- Where the money goes: your expenses as slices of a ring.
- Profit / loss: the net result of each month.
- Cumulative profit: the running total over the period.
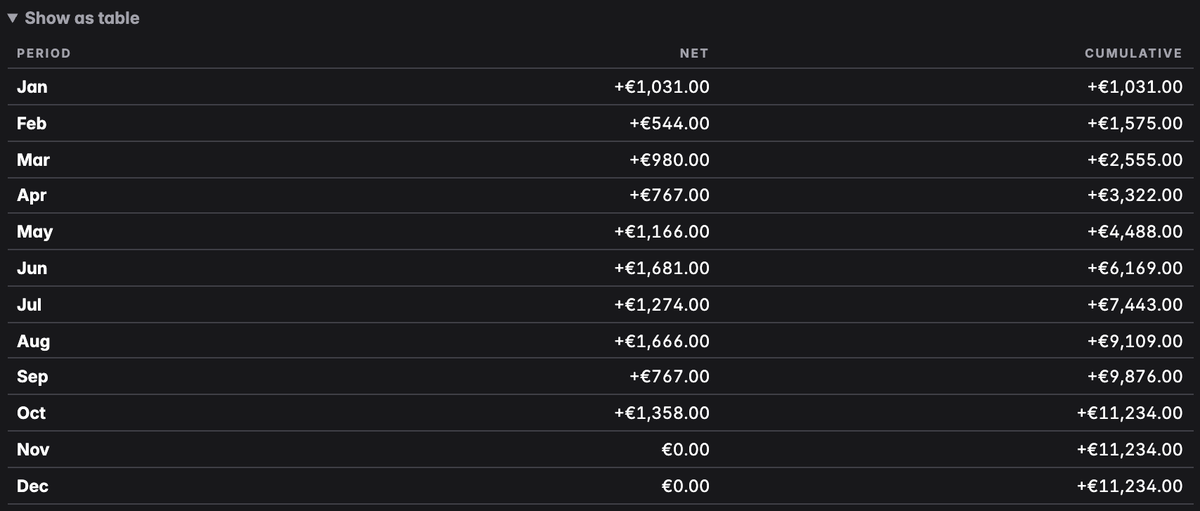
- Show as table: the same numbers as a table.
- The little label tells you how the period is split up.
The split depends on the period you picked in the ledger:
| Ledger period | Charts show one bar per |
|---|---|
| Week | day |
| Month | week |
| Quarter or Year | month |
| All to date | year |
The statistics follow the ledger: ignored entries are always left out, and when Hide scheduled is on, scheduled tournaments are left out too.
Earnings & expenses
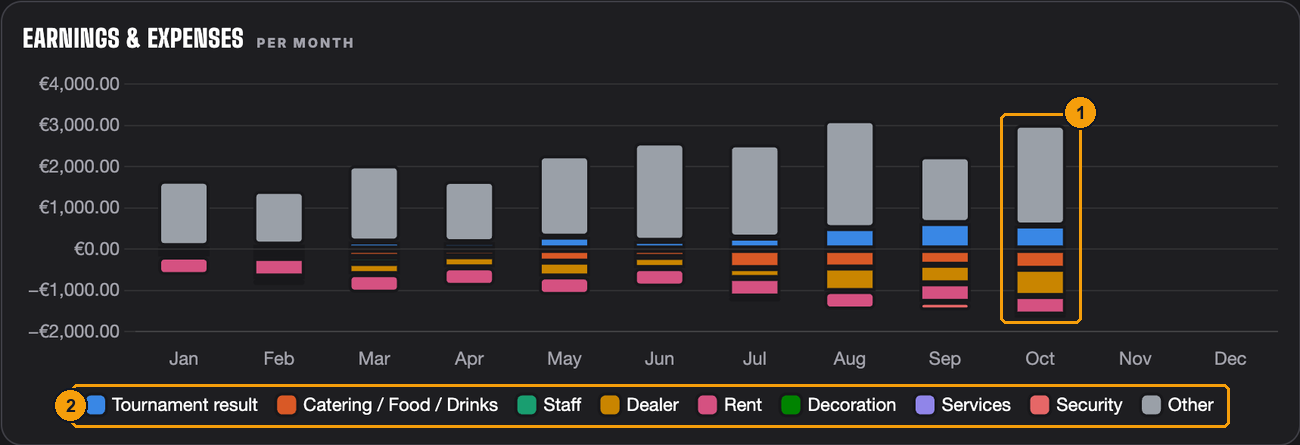
Each bar is one month. Everything above the zero line is money in, everything below is money out.
- Take October. The big grey block on top is Other (here mostly cash games, drink sales and membership fees). The blue part is the Tournament result. Below the line come catering, dealers and rent.
- The legend tells you which colour is which. Click a name in the legend to hide or show it, for example to look at expenses only.
The built-in types (Catering / Food / Drinks, Staff, Dealer, Rent, Decoration, Services, Security) and the Tournament result each have their own colour. Every type you created yourself is added up under Other. So in a club like Harbor Lights, where cash games bring in most of the money, the grey part is the biggest. If you need your own types one by one, use the PDF report: it lists every type by name.
Hover over a bar to see the exact amounts for that month.
Where the money goes
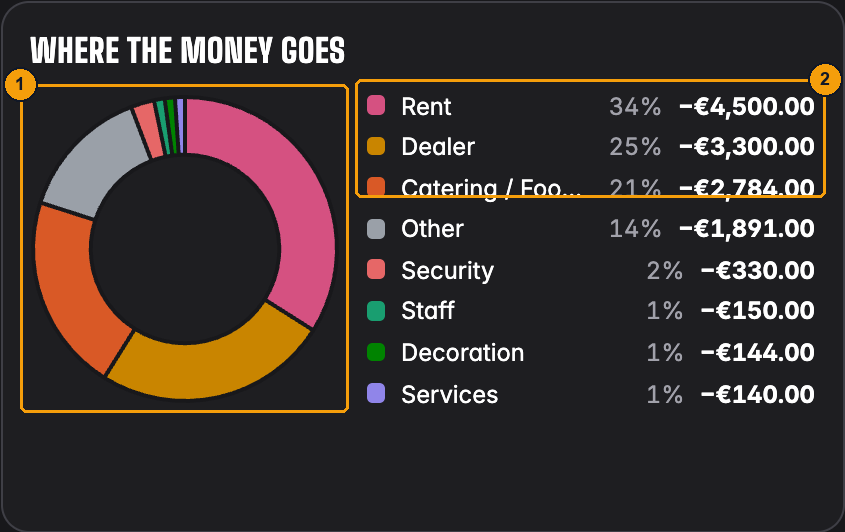
- The ring shows only expenses. The bigger the slice, the bigger its share.
- The legend lists them from biggest to smallest, with share and amount. In 2026 Harbor Lights spent 34% on Rent, 25% on Dealer and 21% on Catering / Food / Drinks.
If tournaments lost money in the period (a guarantee the club had to top up, for example), that shows up as its own slice called Tournament losses.
Profit / loss
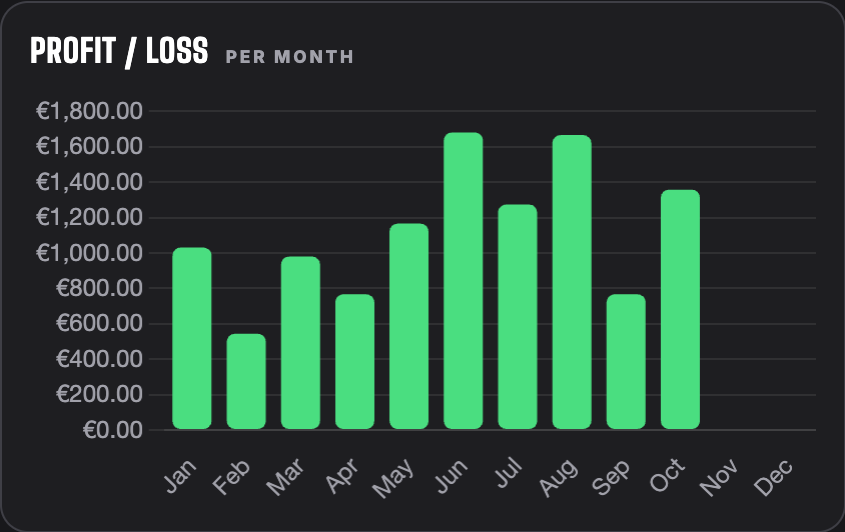
One bar per month, green when the club ended the month ahead, red when it ended behind. This is the chart to look at when someone asks "are the summer months worse?". For Harbor Lights the answer is no: June and August were the best months of the year.
Cumulative profit
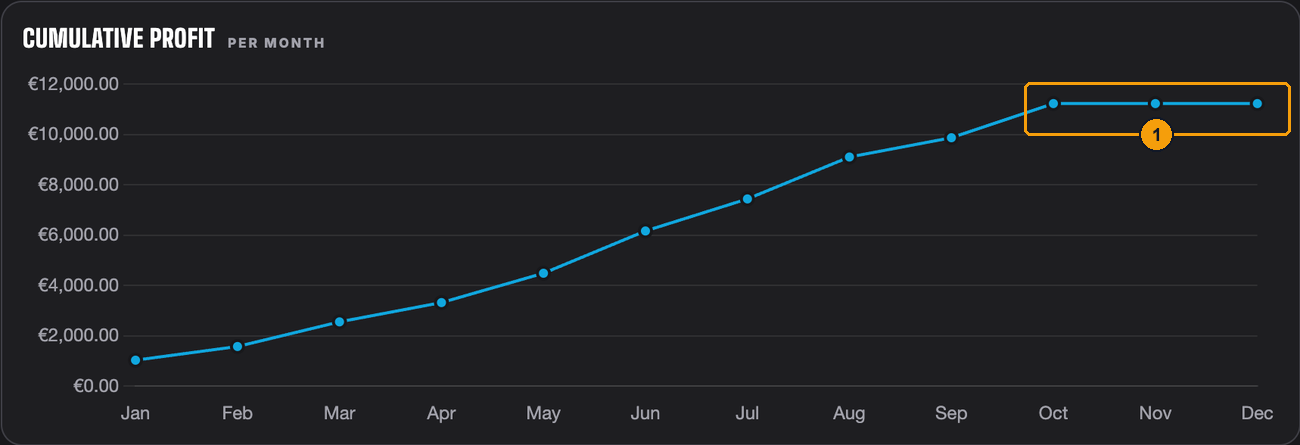
The line adds each month to the ones before, so the last point is the result for the whole period. A line that climbs steadily means a healthy club. A dip means some months ate into what earlier months made.
- After October the line is flat. That's not a bad sign: November and December just haven't happened yet.
Show as table
Click Show as table below the charts for plain numbers, one row per month with its Net and the Cumulative total. It's handy if you want to copy figures somewhere else:
The PDF report
Click Report in the ledger. The Create report window opens:
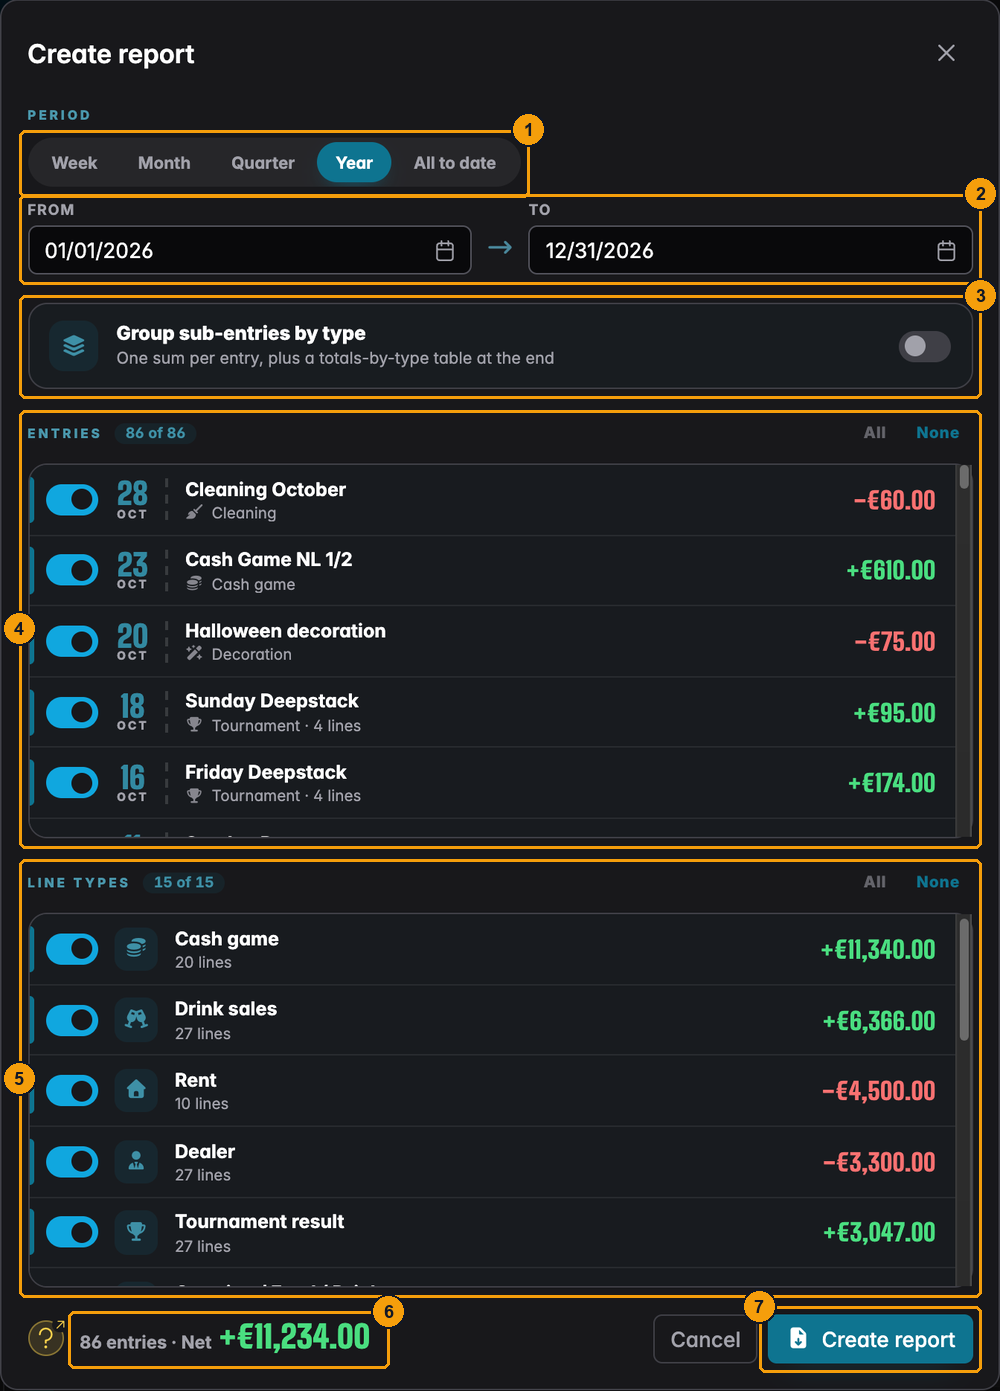
- Period presets: Week, Month, Quarter, Year and All to date. They start from the period you had open in the ledger, so if you were looking at 2026, Year means 2026.
- From and To: the exact first and last day. Both days count. Change either date and the preset switches to Custom.
- Group sub-entries by type: off gives a detailed report with every line of every entry. On gives one line per entry, plus a Totals by type table at the end.
- Entries: every entry in those days, each with a switch. All and None switch them all at once. The counter shows how many are in (here 86 of 86).
- Line types: every type that appears in those days, with its total. Switch a type off and it disappears from every entry in the report.
- A live summary of what the report will contain: number of entries and the net.
- Create report builds the PDF and downloads it.
The file is named after the club and the dates, for example
harbor-lights-poker-club-financials-2026-01-01_2026-12-31.pdf.
A few things are left out on purpose:
- Ignored entries never go into a report. If there are any in your dates, the window says how many were left out.
- Scheduled tournaments without figures don't appear. There's nothing to report yet.
- The report uses your account currency, like the ledger.
Switching things off
The switches are what make the report useful for more than one question. Say the club committee wants to know whether the tournaments and the bar would pay for the club on their own, without the cash games. For the summer quarter:
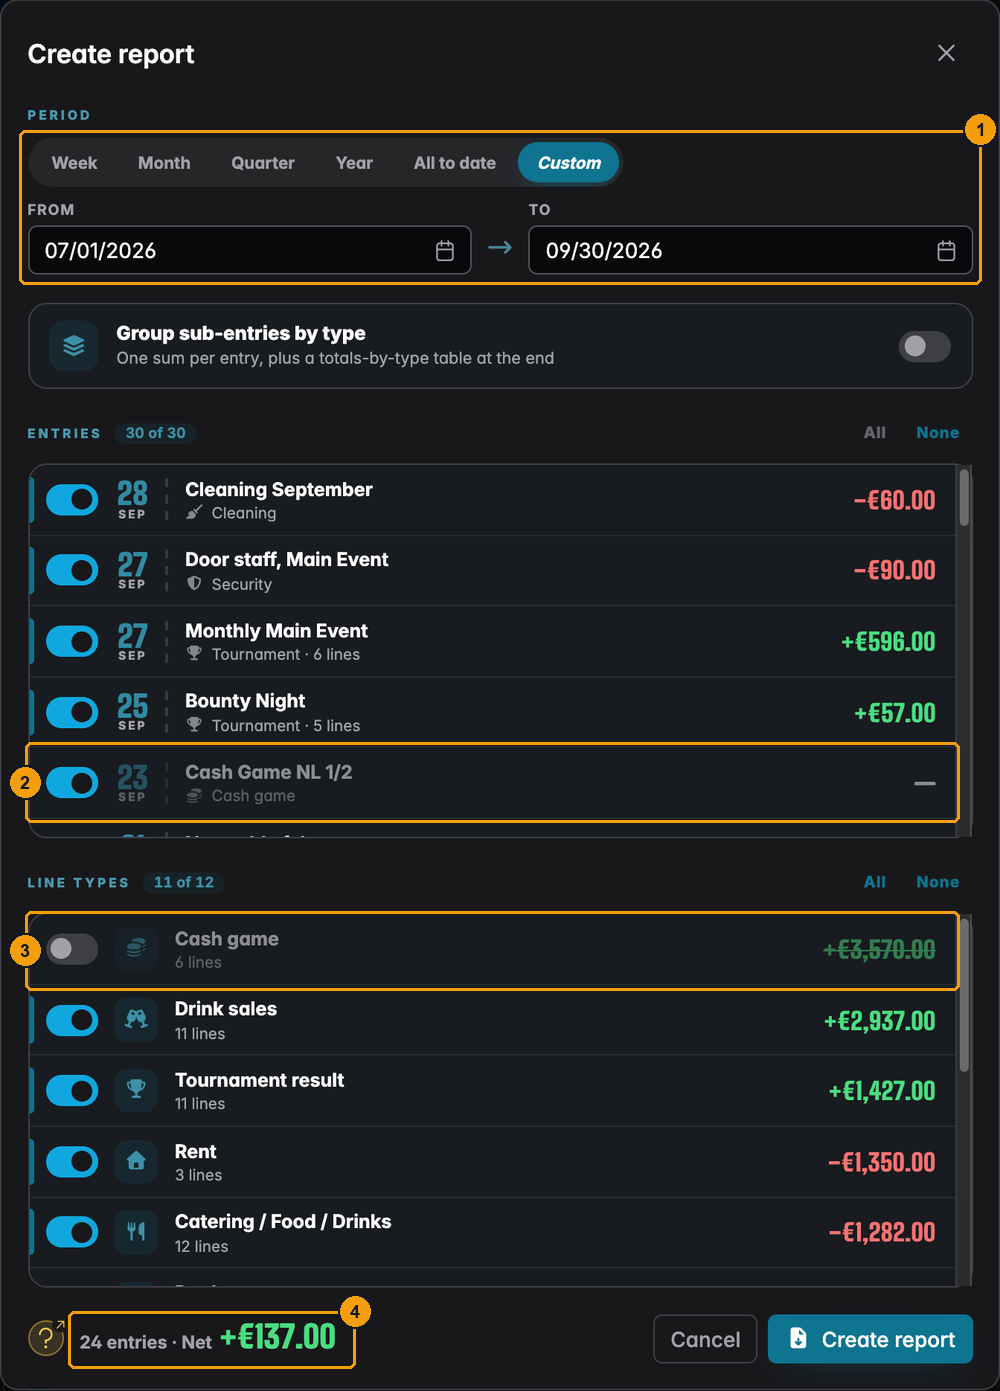
- From 07/01/2026 To 09/30/2026. The preset now says Custom.
- Entries that only had cash game lines show a dash. They drop out of the report.
- Cash game is switched off under Line types.
- Without cash games, the quarter ends at +€137. With them it was over +€3,700.
So the cash games carry the club. That's an honest answer you'd struggle to get from a notebook. Here is the top of the PDF it makes:
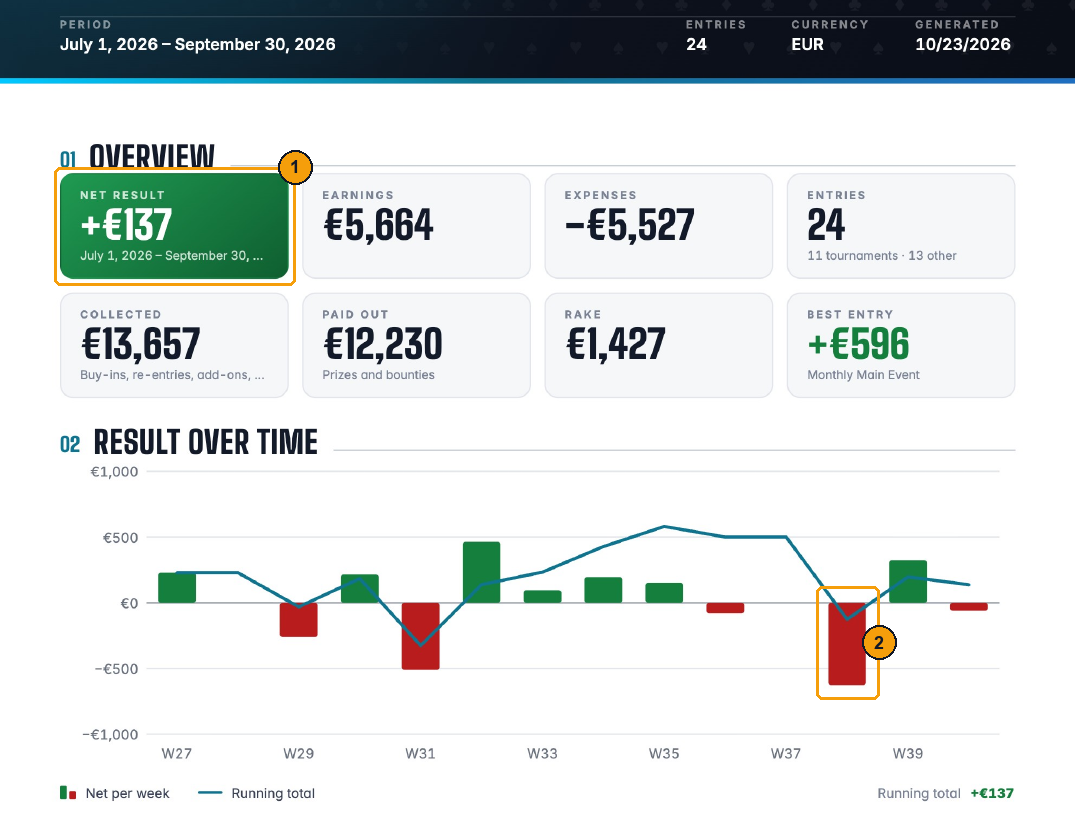
- Net result +€137 for the quarter.
- The deep red bar in mid-September is the week the club bought four ceramic chip sets (−€780). For a three-month report the bars are weeks, so a single big purchase stands out clearly.
You can also switch off single entries, for example a one-off equipment purchase you'd rather explain separately, or switch everything off with None and turn on just the tournaments you want to compare.
What's in the PDF
The report is a set of A4 pages in the club's colour, with the club picture in the header. The page numbers say "Page 1 of 5" and so on, and the footer shows when it was created.
Page 1: overview, result over time, types
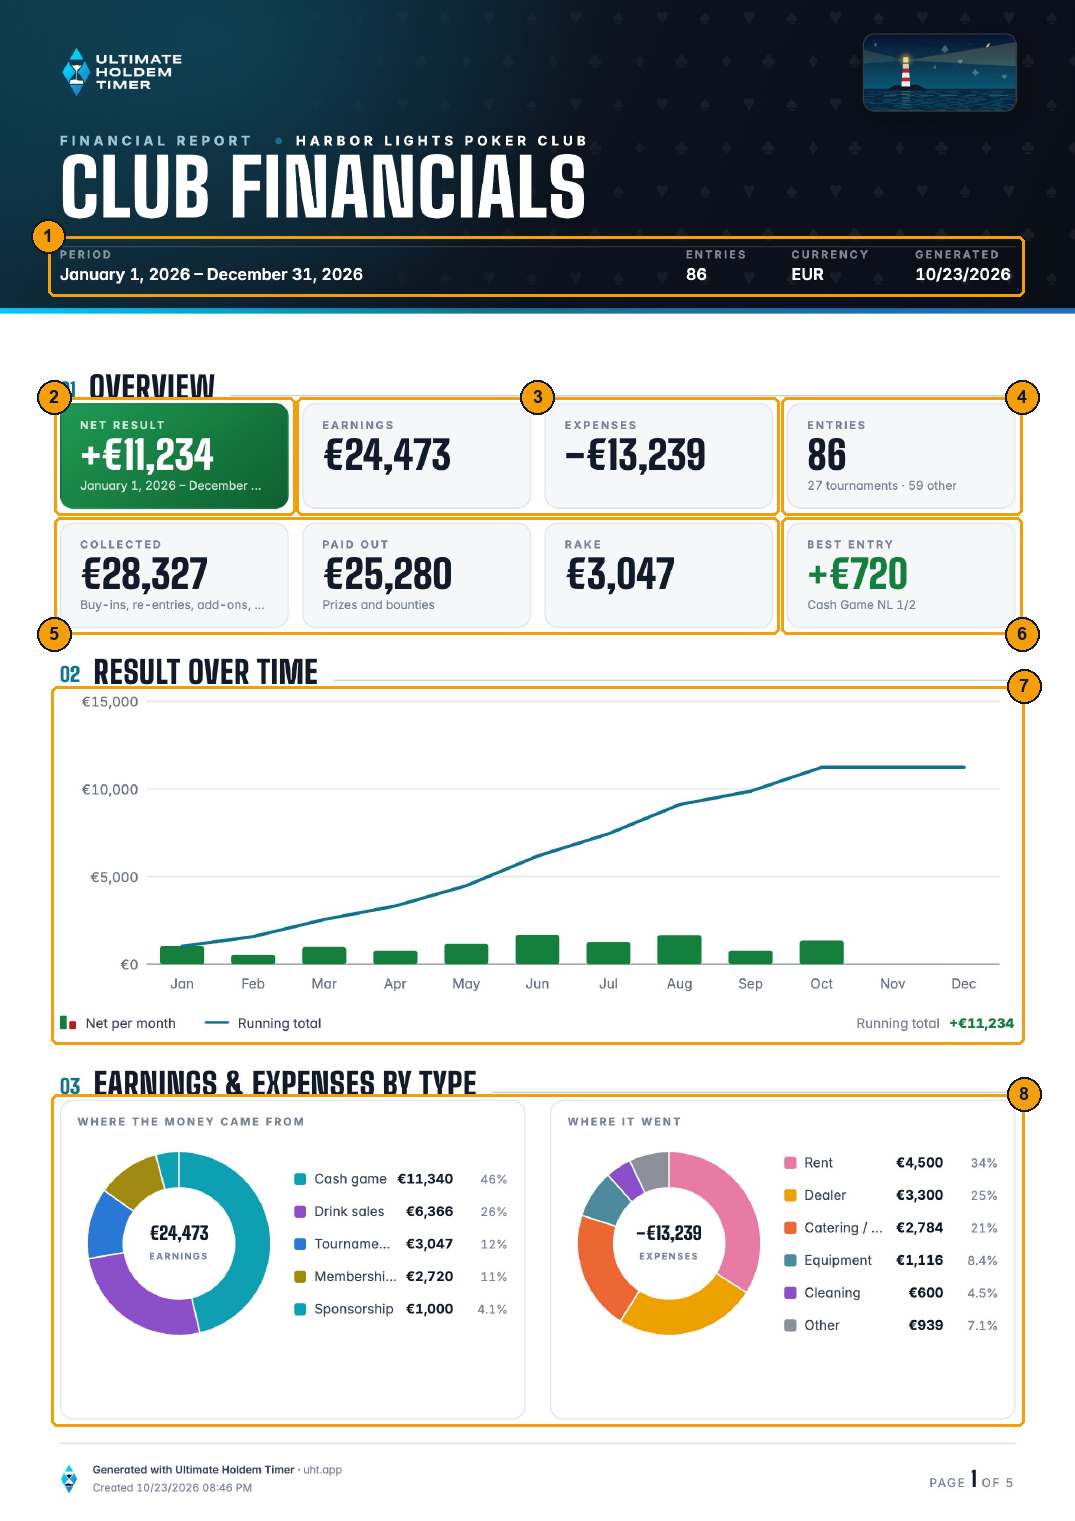
- Period, number of Entries, Currency and the day it was Generated.
- Net result: the bottom line for the period.
- Earnings (everything that came in) and Expenses (everything that went out). Tournament results count as earnings here. A tournament that lost money counts as an expense.
- Entries: how many, split into tournaments and other entries.
- Collected, Paid out and Rake: the tournament money. What players paid, what went back to them, and the fees the house kept.
- Best entry: the single entry that made the most.
- Result over time: a bar for each part of the period (green up, red down) and a line for the running total.
- Earnings & expenses by type: two rings, Where the money came from and Where it went. Each shows up to six types. Smaller ones are added together as Other.
The bars in Result over time adapt to the length of the report: days for up to two weeks, weeks for up to about three months, months for up to about three years, years beyond that.
Ranking and entries
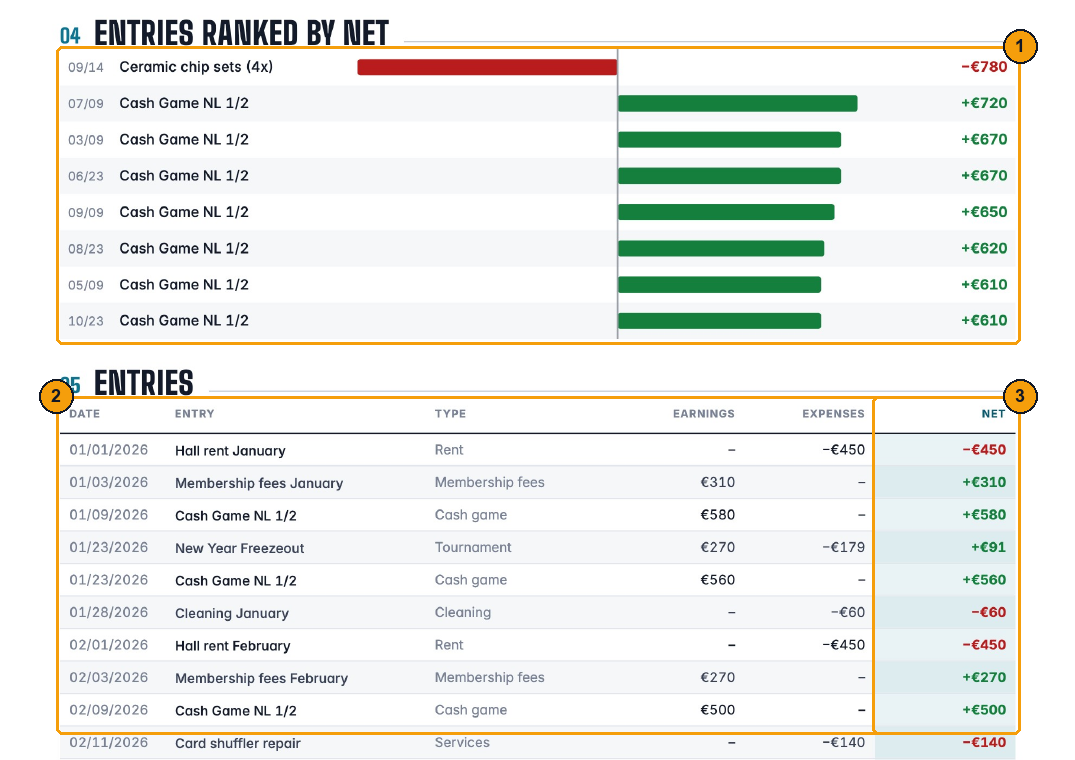
- Entries ranked by net: the eight biggest entries, by size. Gains go to the right in green, losses to the left in red. In 2026 the biggest single item was a cost: the ceramic chip sets (−€780). Most of the rest are cash games.
- Entries: every entry in date order, with Date, Entry, Type, Earnings, Expenses and Net. The table ends with a Total row.
- The Net column is shaded so it's easy to follow down the page.
Totals by type (grouped report)
With Group sub-entries by type switched on, the report ends with one row per type:
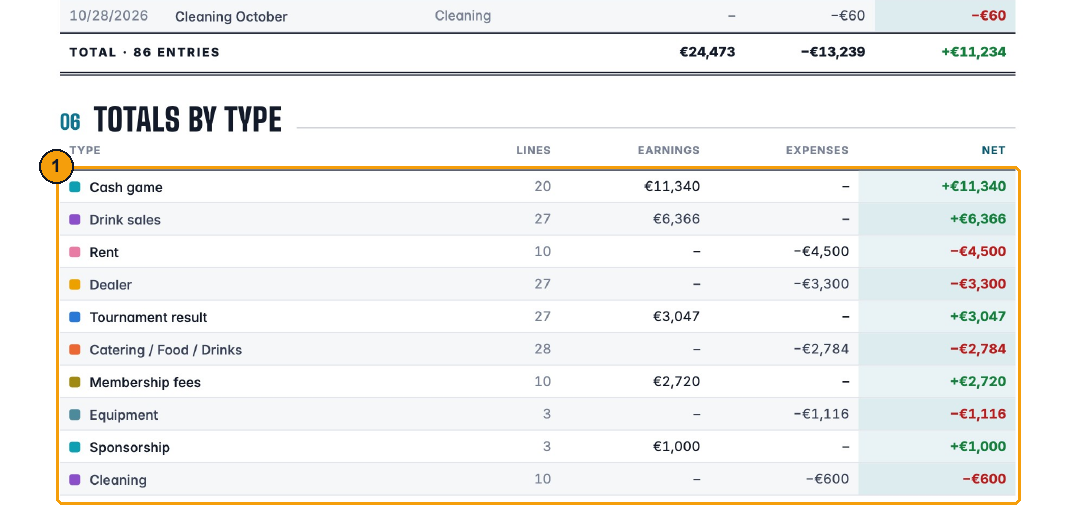
- Each type with the number of Lines, its Earnings, Expenses and Net, biggest first. This is where your own types finally show up one by one: Cash game, Drink sales, Membership fees, Equipment and so on.
Every line (detailed report)
With Group sub-entries by type switched off, each entry gets its own block instead:
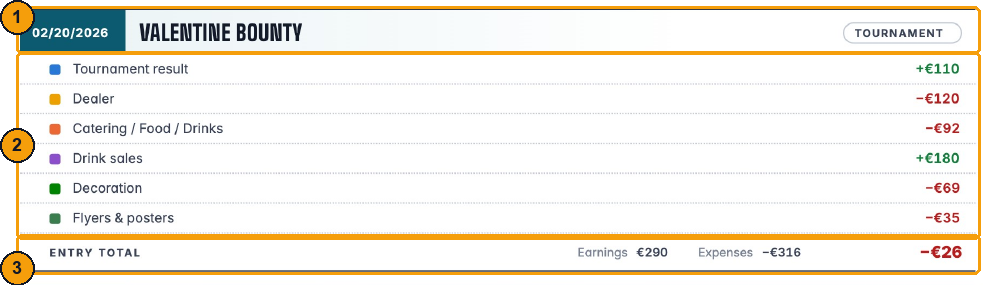
- Date, name and type of the entry.
- Every line, with the same colour as in the charts.
- Entry total with its earnings, expenses and net.
The detailed version is longer (the 2026 report is 13 pages instead of 5) but it answers any "what was this €69?" without opening the app. Use the grouped version for the meeting and the detailed one for the treasurer's folder.
Worked examples
End-of-year summary for the club meeting
- Open Financials, choose Year and make sure it shows the year you want.
- Click Report. The period is already set to that year.
- Switch Group sub-entries by type on. Five pages are easier to hand out than thirteen.
- Leave all entries and types switched on and click Create report.
For Harbor Lights in 2026 the report tells this story:
- The club made +€11,234 over the year.
- Cash games brought in €11,340 and drink sales €6,366. Tournament results (the rake) added €3,047 and membership fees €2,720.
- The biggest costs were rent (€4,500), dealers (€3,300) and catering (€2,784).
- The tournaments' rake (€3,047) doesn't quite pay the dealers (€3,300). Tournaments pay off through the drinks people buy while they play.
That's a useful point for a meeting where someone suggests raising the rake.
Closing a month
At the start of each month, take five minutes for the month before:
- In the ledger choose Month and step back with the arrow.
- Book what's missing with New entry: rent, cleaning, membership fees, cash games.
- Check every finished tournament has its dealer and food on it.
- If a tournament's numbers don't match the cash box, fix them with Edit figures.
- Click Statistics, glance at Profit / loss, and you're done. Or create a Month report for the folder.
One night, on paper
The night's own page in the ledger already shows its full result (see Expenses and earnings on a tournament). If you need it as a PDF, for a sponsor for example, open Report, set From and To to that day, and switch off the entries you don't want with their switches.
Comparing two kinds of night
Want to know whether the bounty nights do better than the Friday deepstacks? Open Report for the year, click None under Entries, and switch on only the bounty nights. Note the net in the summary at the bottom. Then do the same for the deepstacks. You don't even need to create the PDF: the summary line updates as you switch.
Questions
Why are my cash games grey "Other" in the statistics? The statistics give their own colour only to the built-in types and the tournament result. Types you created are combined as Other. The PDF report lists every type by name.
The statistics don't match what I see on the page. The statistics cover the whole period, the list only shows 20 entries per page. Also check Hide scheduled and whether some entries are ignored.
Why doesn't the PDF include a tournament from last week? It's either ignored, outside the From/To dates, switched off in the list, or it hasn't finished yet.
What's the difference between "Rake" and "Tournament result"? Rake is the fee you charged on top of the buy-ins. The tournament result is what the tournament left after paying everything back: usually the rake, less any money the club put into a guarantee. If you never guarantee prize pools, both are the same.
Can I export to Excel? Not directly. Show as table in the statistics gives you numbers you can copy, and the PDF lists every entry.
The PDF takes a while. Is that normal? Yes, a long detailed report can take some seconds. The button shows Creating PDF… until the download starts. Don't close the window in the meantime.